

Cars and Trucks and Uneven Fights
Why small cars vs. big trucks is like the 49ers vs. a high school football team

In previous posts, I looked at cyclist safety and pedestrian safety. When a car or truck crashes into a bike rider or a pedestrian, it’s a sad and uneven fight.
In this post, I look at two-vehicle crashes, considering safety both inside and outside of a vehicle. It turns out that two-vehicle crashes are quite uneven too. Perhaps that shouldn’t be surprising — a 1996 Honda Civic weighs 2238 pounds while a RAM 1500 is more than three times as heavy (6900 pounds)— but I was still surprised by just how uneven the road is.
Let’s walk through the numbers, and find out why a car-truck crash is like a football game between the 49ers and a high school team.
Happiness is a Warm Gun; Safety is the Inside of a Truck
In two-vehicle crashes between 2016 and 2021 involving both one truck1 and one car, 80.4% of fatalities were the driver or a passenger in the car. Just 19.6% of those killed were the driver or a passenger in the truck.
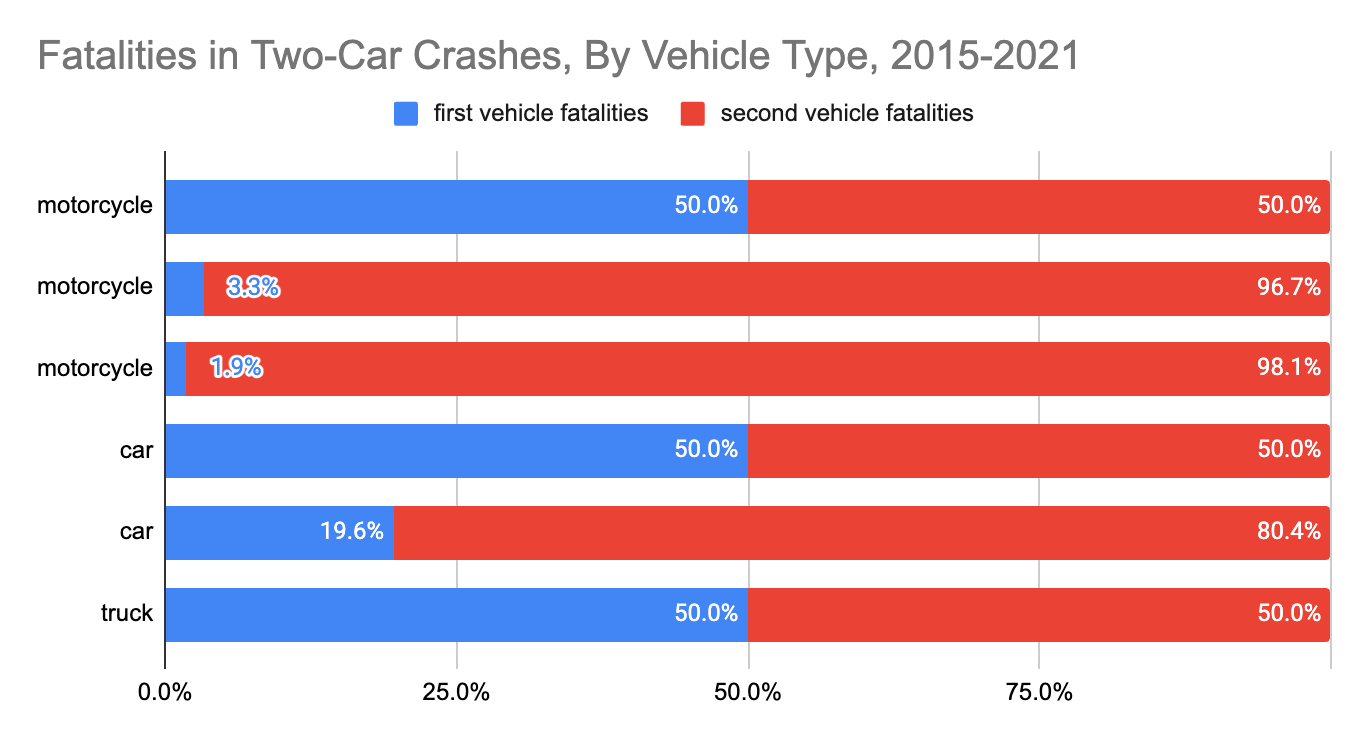
Motorcyclists, not surprisingly, fare much worse: when a car and motorcycle collide, motorcyclists and their passengers represent 96.7% of fatalities; in motorcycle-truck crashes, motorcycle riders account for 98.1% of people killed.
Big New Cars and Trucks Are Safer (But Only If You’re Inside Them)
As cars have grown in size and weight, a similar discrepancy has developed between older cars and newer cars. When a car with model year between 1995 and 1999, and a car with model year 2010-2014 collide, 73.1% of fatalities happen to drivers and passengers in the older car.

When a late 1990s truck collides with an early 2010s truck, the driver and passenger in the 1990s truck is significantly more at risk, bearing 63.3% of fatalities.
When a late 1990s model car collides with an early 2010s truck and someone is killed, an astounding 91.4% of deaths come from people in the older car. Just 8.6% of crash victims come from the newer truck.
These large differences show up even in a fairly coarse analysis that doesn’t separate cars by make or model. Collisions between the biggest trucks and the smallest cars yield even more lopsided results.
Do Big Cars Make Us Collectively Safer or Less Safe?
The numbers above show that there is a huge difference in relative risk based on which vehicle one is in. However, they don’t indicate one way or another whether newer, bigger cars and trucks increase or decrease the total risk in the system.
There are three plausible scenarios:
Scenario 1: The roads are more unequal, but the total risk goes down. In this scenario, new cars are much safer for people inside the car, but no less dangerous for people outside the car. 100 crashes involving one 1996 model year car and one 1998 car might result in 5 fatalities for 1996 model year car drivers and passengers, and 5 fatalities for 1998 car drivers and passengers (10 fatalities total). And in 100 crashes involving one 1996 car and one 2013 truck, there would be 5 fatalities of drivers and passengers from the 1996 car, but just 2 from the 2013 truck (7 total). Hence there would be a decrease in the total number of deaths, even as the road became less equal.
Scenario 2: The roads are more unequal, and the total risk goes up. In this scenario, 100 crashes between 1996 and 1998 cars result in 10 fatalities as above. However, when one 1996 car and one 2013 truck collide 100 times, there are 8 fatalities from the 1996 cars and 4 from the 2013 trucks — a total of 12 fatalities. In this scenario, the 2013 driver may be better off than she would have been in a 1998 car, but the total risk of the road increases.
Scenario 3: The roads are more unequal, and the total risk stays the same. In this scenario, the overall risk doesn’t change, but it’s distributed less evenly. This scenario could happen if 100 crashes between 1996 cars and 2013 trucks killed 7 people from the 1996 cars and 3 from the 2013 trucks (10 fatalities in total). In this situation, the overall number of fatalities is the same, but distributed differently.
Which scenario best reflects reality?
To answer that question, I ask you to imagine two worlds that are different from the world we now live in:
The world where everyone drives a truck
The world where everyone drives a car
The World Where Everyone Drives a Truck
Between 2015 and 2021, there were 16,071 people killed in two-truck crashes.2 In total, there were 62,666 people killed in two vehicle crashes where neither vehicle was a motorcycle.
If we know the percentage of vehicle miles traveled (VMT) that were in trucks (i.e., truck miles driven / (car miles driven + truck miles driven)), we can determine what traffic safety numbers would look like in a world where everyone drives a truck.3
Unfortunately, I have not been able to get my hands on this number, so I will do my best to estimate it.4
Road users who are most vulnerable are (in no particular order) motorcyclists, bike riders, and pedestrians. 56.8% of bike rider deaths5 are the result of collisions with a truck as opposed to a car, 55% of pedestrians are truck crashes, and 53.7% of motorcyclist deaths are truck crashes.
Although there are many factors at play for each of these statistics, I believe it is highly unlikely that trucks are less likely to kill cyclists, pedestrians, or motorcyclists with every mile driven. If that assumption is correct, it means that the number of truck miles driven is less than 56.8% (the truck share of bike rider deaths), less than 55% (the share of pedestrian deaths), and 53.7% (the share of motorcyclist deaths). I will use 53.7% as an upper bound on the truck share of VMT for this analysis.
Because there is substantial evidence that truck sales have outpaced car sales since 2001 (with the exception of 2008 and 2009), I’ll use 52% as a lower bound on truck VMT share.6
With that range calculated, we can answer the relevant question: what would car crashes look like if everyone drove a truck?
The answer is that two car crashes would have killed between 55,731 and 59,434 people between 2015 and 2021. If our upper bound was correct, it would mean that truck-truck crashes would kill 16,071 * (100/53.7) * (100/53.7) = 55,731 people. If our lower bound was correct, truck-truck crashes would have killed 16,071 * (100/52) * (100/52) = 59,434 people. Both numbers are significantly less (6,935 and 3,232, respectively) than the actual number of 62,666 deaths in two-vehicle crashes.
In this scenario, pedestrian fatalities would also increase by between 797 (in the upper bound case) and 2,459 (in the lower bound case), while cyclist fatalities would increase by between 306 and 543. This would diminish, but not erase the overall decrease in automobile crash fatalities.
In short, it’s likely that if all vehicles on the road were trucks, the total number of crash fatalities would stay the same or decrease slightly.
The World Where Everyone Drives a Car
Between 2015 and 2021, there were 13,833 people killed in two-car crashes. We can use this data to conduct a similar analysis to the one we just did for trucks.
In the upper bound scenario (53.7% of VMT are from trucks today), a world with only cars and no trucks would have 64,528 deaths in car-car accidents: 13,833 * (100/46.3) * (100/46.3). This is an increase of 1,862 from the current number. However, in this same scenario, 394 fewer cyclists and 1,204 fewer pedestrians would be killed — meaning a very slight increase in the number of deaths: 264 more deaths over seven years.
In the lower bound scenario, the numbers are much better: 60,039 deaths in two-vehicle crashes (a decrease of 2,627), and an additional decrease in fatalities because the roads are safer for cyclists (588 fewer deaths) and pedestrians (2,664 fewer deaths).
In other words, in a world where all vehicles are cars, the total number of crash fatalities would also stay the same or decrease slightly.
We’re Somewhere Between Scenario 2 and Scenario 3
The fact that both the car-only world and the truck-only world would constitute either no change or an improvement over what we have today indicates that we must be in Scenario 2 or Scenario 3. In Scenario 2, our real-world system has led to the roads being more unequal, and the total risk going up. In Scenario 3, our real-world system has led to the roads being more unequal and the total risk staying the same.
I short, my analysis suggests that the total risk is somewhere between 0% and 5% higher in our current system than it would be in a world where every vehicle was a car or every vehicle was a truck.
NFL Players and High School Football Players
Imagine you are organizing an American football league. You can have teams made up of high school football players, teams made up of NFL players, or both kinds of teams.
If the league only has NFL players, there will be some injuries because football is a rough game and athletes who are fast and strong will hurt one another.
If the league only has high schoolers, there will be some injuries because football is a rough game and athletes who are young and inexperienced will hurt each other.
If the league has both high schoolers and NFL players, there’s some good news! The NFL players will be less likely to get injured, because half their games will be against high school kids. Also, there’s some bad news: the high schoolers will get physically annihilated in the games against NFL teams.
This is essentially the situation on the road today. Between 2015 and 2021, there were:
13,883 deaths where a car collided with another car
16,071 deaths where a truck collided with another truck
32,712 deaths where a truck and a car collided
Assuming that the car-truck VMT split is close to 50-50, we would expect that car-truck deaths would be about the same7 as car-car deaths plus truck-truck deaths. In fact, they are 9.2% higher, because car-truck crashes are more dangerous than either car-car crashes or truck-truck crashes. The car-truck crashes are like 140 pound high schoolers going up against 250 pound NFL linebackers.
It’s no surprise who bears the brunt of those unequal crashes: the person in the smaller vehicle8. 26,298 car drivers and passengers are killed in car-truck crashes; those same crashes kill 6,414 truck drivers and passengers.
Put another way, people riding in cars in the US are 1.9x more likely to be killed in a crash with a truck than a crash with another car. And people riding in trucks in the US are 2.5x more likely to be killed in a crash with another truck than a crash with a car. Trucks are safer for the people inside them, but much more dangerous for everyone else.
Decreasing My Risk and Increasing Yours
As a homeowner, it’s doubtful that I could get away with a fire treatment that decreased the likelihood of my house burning down by 50%, but increased the likelihood of my neighbor’s house burning down by more than 50%.
As a driver, it’s incredibly easy to do the equivalent and get a truck that’s safer for the person inside and more dangerous for everyone else: light trucks accounted for 79% of auto sales in the U.S. in 2022.
The cost to a driver — in higher insurance fees and higher gas — may be a bit more for a light truck. But truck profit margins for car manufacturers are generally higher, and today there is little incentive for either car buyers or car makers to buy or sell vehicles that make the road safe for others. That seems wrong.
In a future post, I will propose a way to change these incentives.
Using FARS data from NHTSA. Vehicles where body_typ=1 or body_typ=2 or body_typ=3 or body_typ=4 or body_typ=5 or body_typ=6 or body_typ=7 or body_typ=16 or body_typ=17 or body_typ=20 are classified as cars; vehicles where body_typ=80 or body_typ=83 or body_typ=84 or body_typ=85 or body_typ=90 are classified as motorcycles. Other vehicles are classified as trucks. I will continue to refine those definitions and welcome feedback from anyone who is more in the weeds on vehicle types than I am.
This includes all people indicated as being in one of the two vehicles, when two trucks collided and there was exactly one fatality. There were a total of 16,670 people in total killed in two-truck crashes over this time period according to FARS data; 599 of those were presumably outside of either vehicle, and were not included for this analysis.
There are certainly some assumptions here, for instance that the people driving cars today are similar to the people driving trucks, or that swapping out cars for trucks would not change driving behavior in other ways. Though accounting for these difference would change the specific numbers slightly, I don’t believe they would change the big picture.
I could write a blog post or perhaps even a book on the lack of availability of “denominator” data that is vital to understand risk, effectiveness, and much more. I regularly bemoan what I refer to as “numerator journalism” which looks at individual cases of bad outcomes without regard to frequency.
I’m only including crashes with a car or truck for this analysis. There are a small number of fatalities resulting from a cyclist-motorcyclist crash and I’m not including those here because including them would make for a clunkier analysis and not change the underlying result.
This analysis implicitly posits that the number of trucks on the road is appreciably greater than the number of cars: the fact that the average car age is 13.1 years, the average truck age is 11.6 years, and the average vehicle age is 12.2 years is only possible if there are appreciably more trucks on the road than trucks (about 60-40 trucks). However, this analysis only considers the number of vehicles and not vehicle miles traveled.
The math behind this is similar to tossing a coin twice: there is a 25% chance you get two heads (akin to a two-car crash), a 25% chance you get two tails (akin to a two-truck crash) and a 50% chance you get a head and a tail (heads-tails or tails-heads, akin to a car-truck crash).
Not to mention bike riders and pedestrians, who add virtually no risk to other road users.