The Spike In Car Crash Fatalities After George Floyd's Murder
Yes, it's real. Here are some clues as to what's behind it.

After I started writing about increasing numbers of pedestrian fatalities, several people reached out to ask me about whether there was an increase in traffic fatalities for African Americans starting in 2020. They noted some strongly worded tweets1 about Black traffic fatality and homicide rates going up after George Floyd was murdered. Here’s one graph that was shared:

The first simple question they asked me was whether these trends are real. And my analysis — using a different data source (I used NHTSA data, Sailer used CDC data), likely using some different assumptions2 — shows almost exactly the same trend of increased traffic fatalities among African Americans:
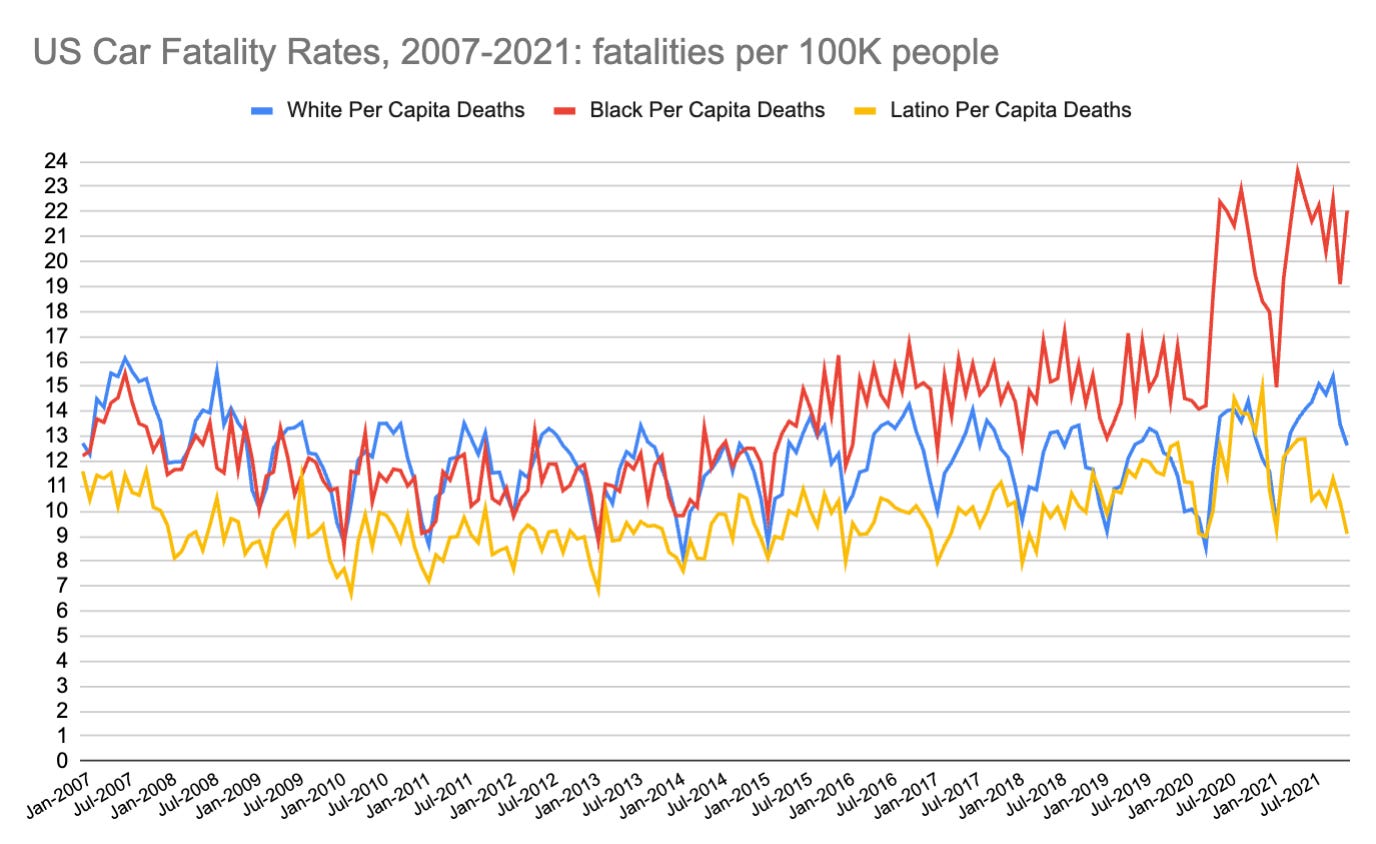
There is a huge spike in the per capita death rate for African Americans in car crashes that happened in the Spring of 2020, staying high over the rest of 2020 and through 20213 (I didn’t look at homicides).
When Did This Increase Happen?
Below are monthly increases in the number of Black people killed in car crashes relative to the year prior (e.g., 5.6% more people were killed in January 2020 than in January 2019, and 1.5% more in February 2020 than in February 2019) for each month of 2020:
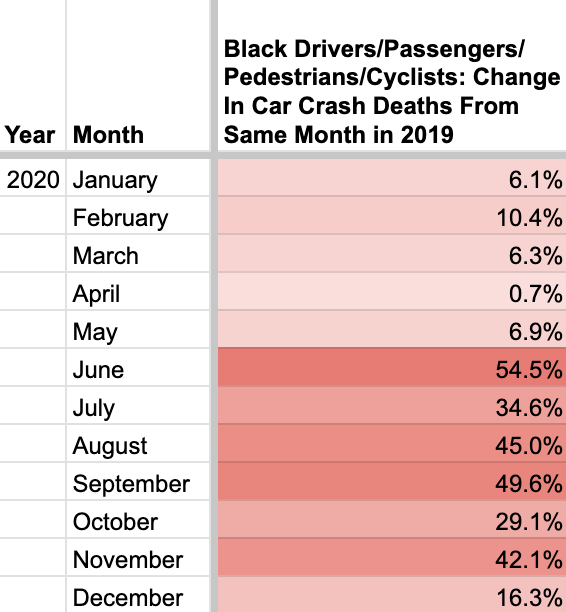
There were year over year increases (there were no decreases) in car crash deaths of Black people, for each month of 2020 relative to the same month in 2019: modest increases for each month between January and May (between 0.7% and 10.4% relative to the same month the year prior) and then a huge spike in June. The number of Black people killed in car crashes in June 2020 was an astounding 54.5% higher than the prior June.
George Floyd was killed on May 25, and mass protests and calls for action started almost immediately after. Just after Floyd’s murder, there was an increase in fatalities, and they continued through the end of 2020.
Accident Rates by Time of Day
That increase in fatal crashes was disproportionately at night, though there were increases at all times of day:
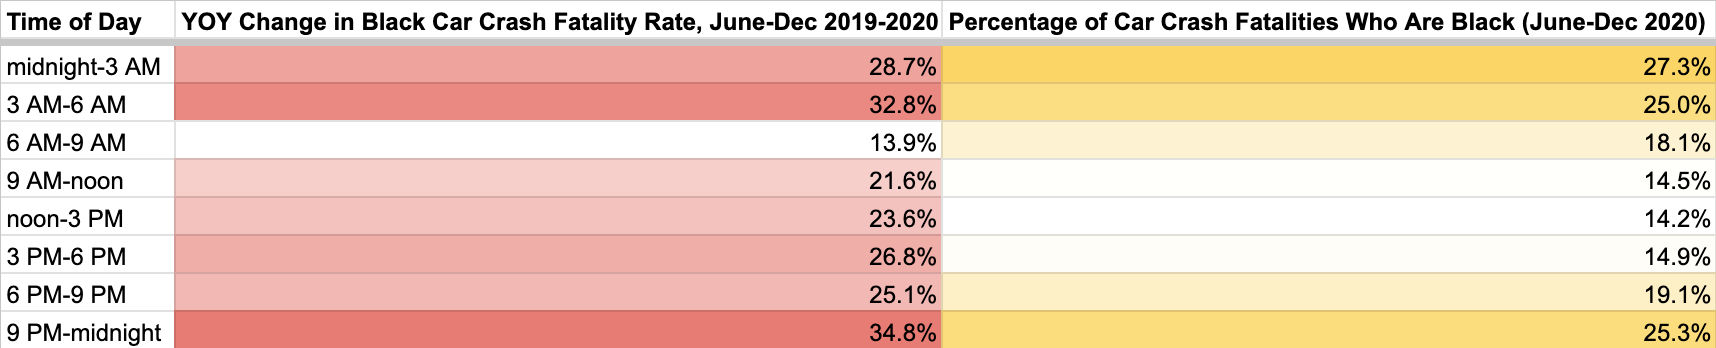
There was a double-digit increase in fatality rate for all hours of the day, but it was largest between 9 PM and 6 AM. Those are also the hours where car crash fatalities among African Americans are far higher than the Black share of the population in the U.S.
What Drove This Change?
There are several theories for this unfortunate increase:
Steve Sailer posited that the reaction to Floyd “caused police stops of drivers to plummet. So people drove worse.” Sailer’s implication is that police officers pulling over people (including Black drivers) makes drivers less likely to engage in risky behavior; with fewer drivers being pulled over, driving got worse. As I understand it, his implication is that police officers shifted behavior because of political pressure.
Police officers were focused largely on Black Lives Matter protests and counter-protests after Floyd was killed, which meant less time and effort going toward traffic enforcement. Under this theory, police officers shifted behavior because they had to monitor protests and changes.
African Americans were understandably traumatized by Floyd’s murder, and their trauma led to many challenges and bad outcomes, including more car accidents.
It’s possible that behavior changed in some way that does not relate to any of the above. Your guess on what that might be is at least as good as mine.
For comparison, I’ll note a number of changes in car crash fatalities for different groups over the same period. In each case, I’m comparing June-December 2019 (pre-Covid and pre-Floyd) with June-December 2020 (post-Floyd)4:

That means that there appears to be both a place effect and a driver effect.
Both white and Black drivers saw (relative to 2019) especially high increases in fatalities in predominantly Black ZIP codes. That is the place effect and it is likely caused by changes that are specific to a given area — like policing.
Increases in majority Black ZIP codes are significantly larger than the increase from a ZIP code being lower income5.
And across both all types of ZIP codes, we see a greater increase in car crash fatalities for Black people. That means that this effect is not only due to place — there is something specific to drivers, passengers, pedestrians, and cyclists that shifted in 2020.
Here are the month by month changes in car crash deaths (with victims of any race) within majority Black ZIPs. The increases are similar to the changes in Black car crash victims:

The June spike is smaller, but there is a big jump for the June-December period.
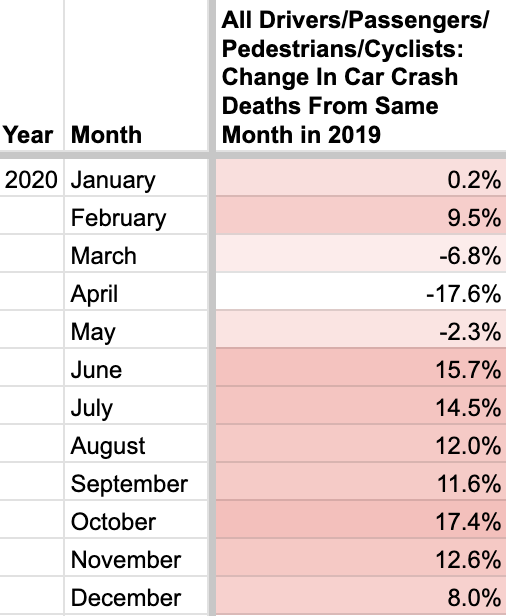
What about month by month fatality rate changes for all drivers comparing 2019 and 2020? There was a (likely Covid-related) dip in fatalities for the months of March through May, and then a much smaller increase starting in June:
What Happened in 2021?
Worse outcomes for Black victims of car crashes unfortunately continued in 2021. Here are month by month numbers for car accident fatalities among Black people, comparing the month in 2021 to the same month in 2019.

However, there’s a sliver of good news: for the months from June to December, the fatality rate for Black people in car crashes declined 7% year over year from 2020.
That positive news is tempered by a bad overall trend in 2021: that year, more than 42,000 Americans died in car crashes, an increase of over 10% from 2020 and the highest number of car crash deaths since 2005. For the months between June and December, car fatalities increased by 5% from 2020 to 2021.
Pedestrian Fatalities
41% more Black pedestrians were killed in the second half of 2020 than in the second half of 2019. This is similar to the total increase in car crash deaths (38%) from June-December (the calculation of car crash fatalities includes pedestrian fatalities).
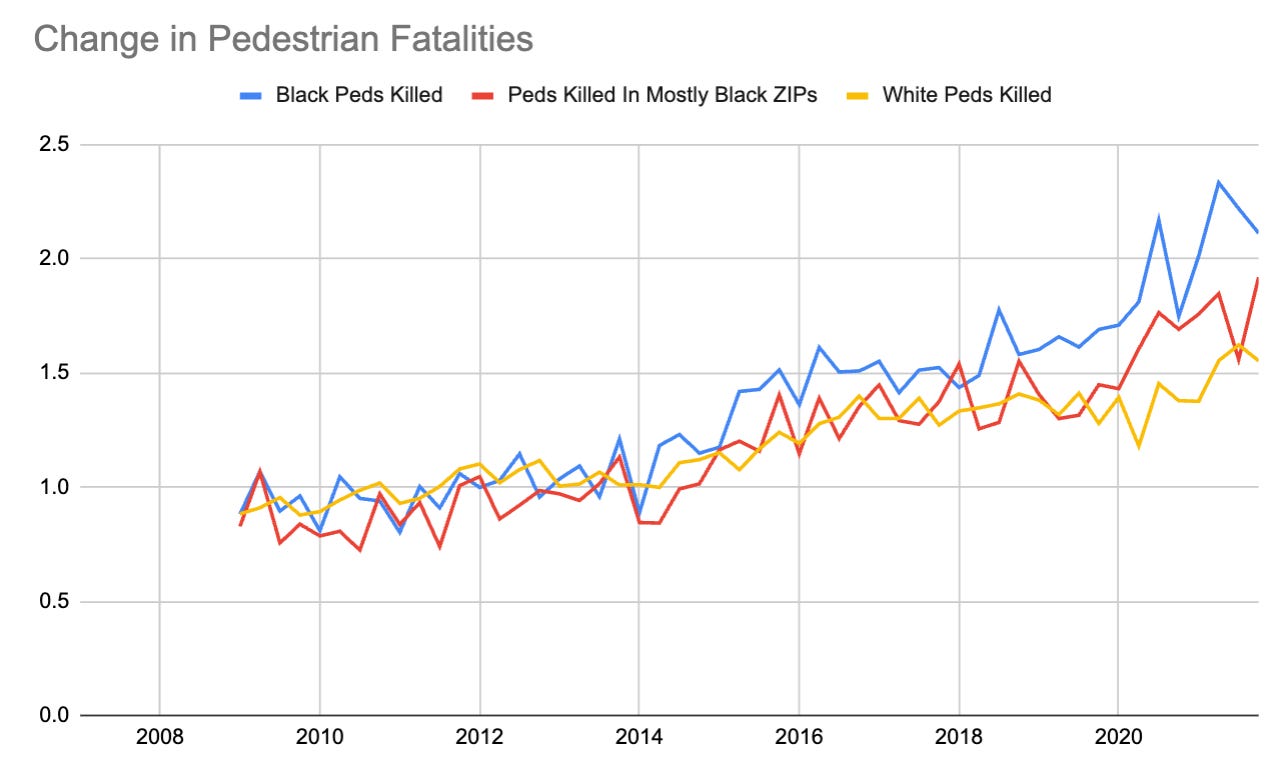
Since the early 2010s, pedestrian fatalities have been going up. Up until 2015, the trends for white pedestrians and Black pedestrians were almost identical.
Then, over the second half of the 2010s, pedestrian fatalities increased more for Black pedestrians (64% up from the 2007-2008 baseline) than for white pedestrians (35% up).
That trend accelerated considerably after George Floyd was killed: in 2021, Black pedestrian deaths were an astounding 117% higher than they were in 2007-2008. White pedestrian deaths were 53% higher.
Going the Wrong Direction
I write about these trends because they represent ways in which the U.S. is moving in the wrong direction, and it’s important to be able to figure out why and course correct.
10,000 more people were killed in U.S. car crashes in 2021 than were killed in crashes in 2011. 10,000 deaths means a lot of lives ended too early — it far eclipses the number of people killed in mass shootings (about 600 per year), by police officers (about 1000 per year), in terrorist attacks (just a handful), and in plane crashes (a handful) combined.
By looking at this and other inflection points, I hope to shine more of a light on where problems are happening and what is causing them.
Prior to a few people reaching out to me about these tweets a few weeks ago, I don’t think I’d ever heard of Steve Sailer or his work. In reading a bit more, I gather that Sailer is — to put it gently — not well received by many in academia, and that many people on the left find him so offensive that they will not even engage with him or his work. Even though I have a very different worldview to Sailer and take issue with many of the things he writes, I will engage with the substance of his work. I aim to evaluate the ideas/theories/policies Sailer (or anyone else) proposes on their merits and not on who/where they came from.
NHTSA data has more people of “unknown” race or ethnicity in some years than others. For this graph, I assumed that fatalities of people whose race were unknown followed the same distribution as other fatalities that year where race was known. e.g., if 70% of known race fatalities were white, 20% Black, and 10% Asian for a given year and there were 100 fatalities of unknown race, I allocated them 70-20-10.
Surprisingly, the NHTSA has not yet released a 2022 FARS data set of traffic fatalities. Their data sets are amazing, and it would be even better if they were released sooner.
Technically, these are ZCTAs, calculated based on the lat/long of the accident from the NHTSA database. ZCTAs are similar to ZIP codes but not quite the same thing; ask Google or ChatGPT if you want to learn more.
Overall, traffic fatalities increased by 24% in the lowest income ZIP codes for June-December 2020 compared to the year prior. The size of the increase was 36% in ZIP codes that are majority Black, 18% in ZIP codes that are majority white, and also 18% in ZIP codes that are majority Latino.
This data is fascinating and should be shared more widely.