Smartphones Probably Aren't the Reason for the Increase in Pedestrian Fatalities
Comparing Smartphone Adoption and Pedestrian Fatalities by Age Group

Earlier this week, I posted about the increase in pedestrian fatalities in the US.
Several people emailed me saying that they suspected that the most likely culprit was the rise of smartphones, and the corresponding increase in distracted driving and/or distracted walking.
That struck me as plausible, and it’s something that others have talked about. However, I hadn’t seen any data that convinced me.
I decided to take a look at different age cohorts. It turns out that, according to Pew Research Center, the rate of adoption of smartphones has been very different by age cohort.
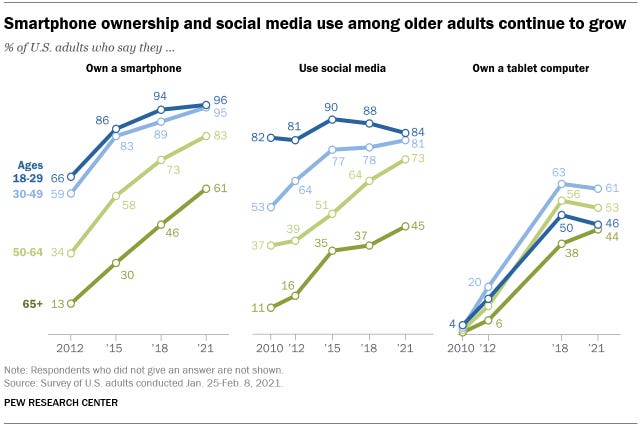
The Pew numbers1 suggest that most people 50 and older did not own a smartphone in 2012, but that a large number (49% of 50-64 year olds, and 48% of those 60+) purchased their first smartphone between 2012 and early 2021.
By contrast, by 2012, most people under 50 already owned a smartphone (59% and 66% for 30-49 and 18-29 year olds), and by 2015, about 85% of people under 50 owned a smartphone.
Smartphones were essentially invented in 2007 — the iPhone launched in June 2007 and the first Android phone was released in 2008.
That means that smartphone adoption followed roughly the following pattern:
From 2007-2012, there was heavy smartphone adoption by people under the age of 50, and low adoption by people over 50.
From 2012-2015, the rate of smartphone adoption was about the same in all age groups (approximately 20% — mostly later adopters among those under 50, and early-to-middle adopters among those 50+).
From 2015-2021, the rate of smartphone adoption was moderate to high among people 50+, and low among people under 50.
And it then follows that if it were the case that smartphones led to more pedestrian crashes, we should see similar patterns. Most notably:
From 2007-2012, we’d expect to see higher increases in fatalities with younger people2.
From 2015-2021, we’d expect to see higher increases in fatalities with older people.
Drivers with Smartphones
Here are changes in fatal pedestrian crashes based on the age of the driver, starting with 2007 as the baseline:
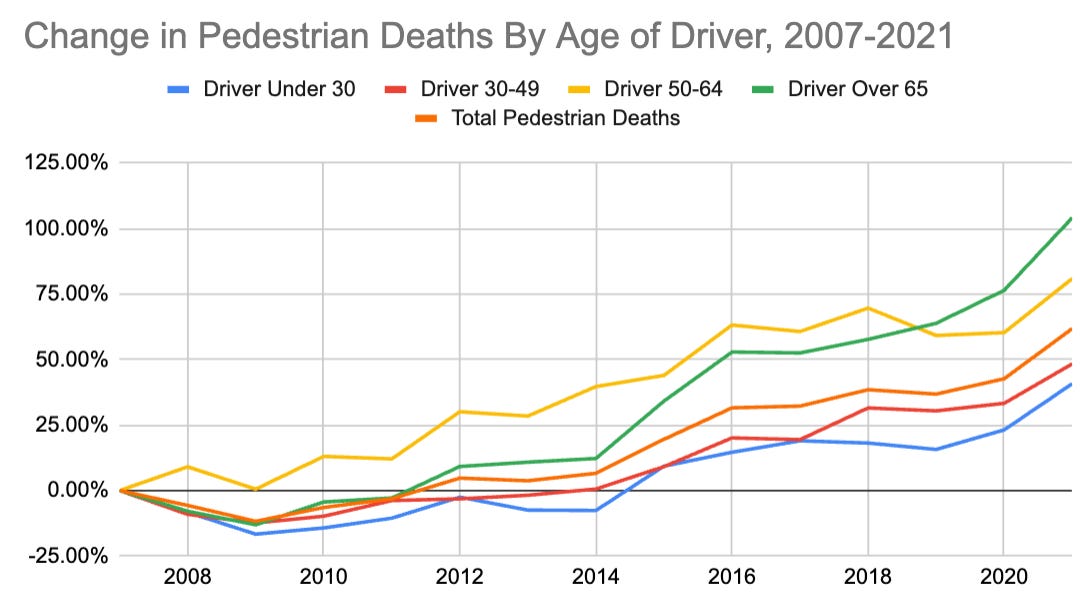
Here we see that drivers 50-64 had by far the worst trend line from 2007-2012, even though their rate of smartphone adoption was relatively low. By contrast, people under 50 had a high rate of smartphone adoption between 2007 and 2012, and they were collectively involved in fewer fatal pedestrian crashes in 2012 (when most of them had smartphones) than in 2007 (when almost no one had a smartphone).
Between 2015 and 2021, all age groups’ driving records got worse. Drivers over 50 fared a bit worse over this period — they killed 39% more pedestrians in 2021 than they had in 2015, while drivers under 50 killed 33% more pedestrians in 2021 than in 2015.
This serves as a relatively weak tie between smartphone adoption of drivers and increased pedestrian mortality. New smartphone adoption among people 18-49 was fairly light between 2015 and 2021 — by 2015 about 85% of younger people had smartphones and only another 10% or so got them in those six years — but 18-49 year old drivers were still involved in far more pedestrian crashes in 2021 than in 2015.
Pedestrians with Smartphones
It could also be the case that pedestrians with smartphones are the problem (or a problem). What do those numbers look like?
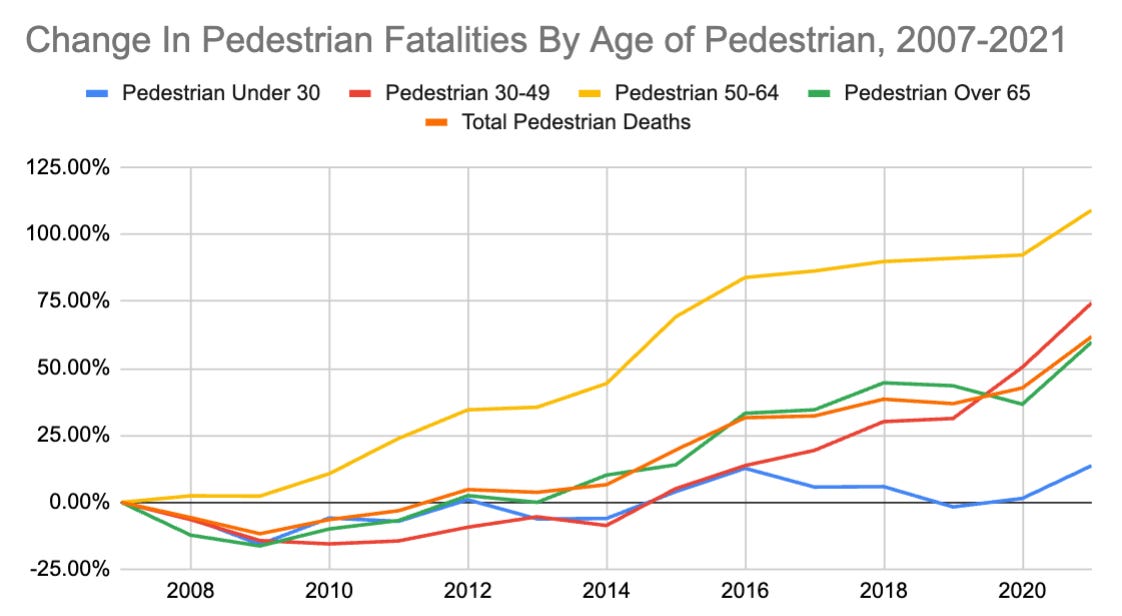
Here we see an even clearer trend: pedestrian deaths among people under 50 were down slightly from 2007 to 2012, when their rate of smartphone adoption was highest. By contrast, pedestrian deaths among people over 50 went up significantly from 2007 to 2012, even as their smartphone adoption was low.
In the period from 2015-2021, smartphone adoption was high among people 50 and over, but pedestrian deaths rose relatively modestly. By contrast, people 30-49 — almost all of whom already had phones by 2015 — were hit and killed by car drivers at a significantly higher rate in 2021 than in 2015.
Summary
Going back to our original set of criteria:
From 2007-2012, we’d expect to see higher increases in fatalities with younger people.
From 2015-2021, we’d expect to see higher increases in fatalities with older people.
We did not see the first trend for drivers. We saw a possible, small effect size on the second trend for drivers.
Neither of the trends we were looking for appeared for pedestrians.
In short: the evidence that smartphone adoption by drivers is a significant cause of pedestrian fatalities is slim, but may have a small effect. In particular, it may be worth investigating smartphone penetration with older drivers, and the impact on pedestrian fatalities.
Based on the relative rates of smartphone adoption, I see no evidence that smartphone adoption by pedestrians is a significant factor.
Long Days, Long Nights
Several people also mentioned being struck by just how much of an effect darkness has on pedestrian fatalities. Here’s a graph of average pedestrian fatalities per day in each month (from 2007-2021), plotted versus the number of daylight hours per day that month in Washington, DC.
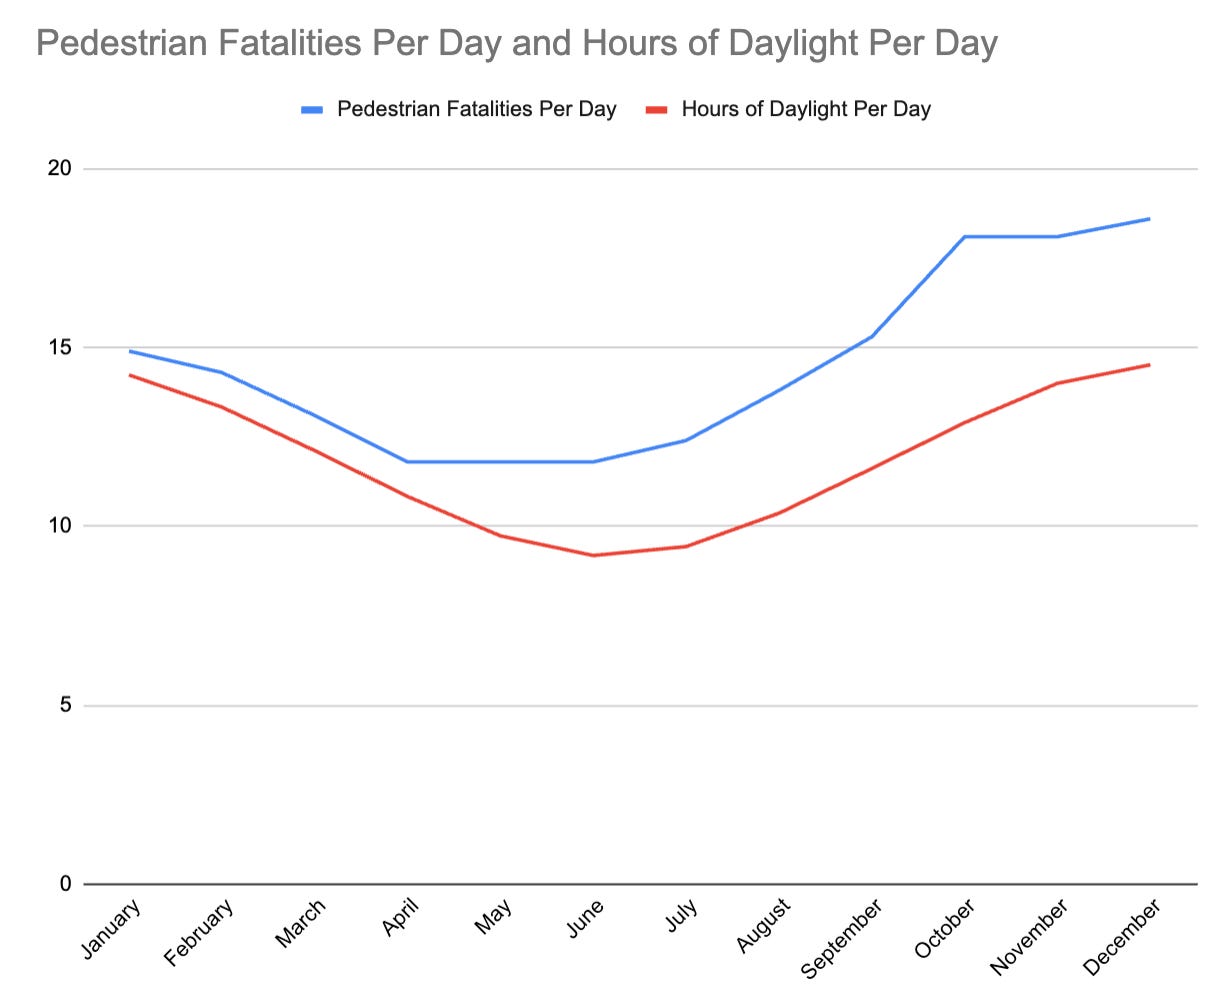
The month with the least daylight is December, and the month with the most pedestrian fatalities is December. The month with the most daylight is June, and the month with the fewest pedestrian fatalities is also June. That is not a coincidence!
December has 58% more pedestrian fatalities per day than June. I happen to be writing this on December 21, the longest night of the year; whether you are driving or walking or cycling at night, please be careful!
There’s a little bit of an asterisk here in that some of these cohorts are people aging from one cohort to another. But for the purposes of this analysis and a comparison to car crashes, that shouldn’t matter.
In this analysis, I didn’t adjust for changes in the size of different cohorts over time. That would change the specific numbers by a few percent, but that would not shift the underlying narrative in a material way.
There was a mention on twitter about smart phones still being the predominant issue. Is it possible to look up and compare EU or Japanese data to look for comparisons?
I would guess that just considering increases in traffic wrt new road construction might have more correlation than the smart phone data.
Very well done, and great read!